
NAAB REPORT ON ARCHITECTURE EDUCATION 2025
As it does each year, NAAB (National Architectural Accrediting Board) recently released its annual report on Architecture Education.
As shared on the NAAB, — This report, to be produced annually, shares the accreditation decisions made by NAAB in the previous year, provides a review of the aggregated statistics provided by each accredited program, and reports on other activities.
In promoting the annual report, they share, “What’s happening in architecture education and accreditation? Get the latest data, trends, and insights in the 2025 NAAB Annual Report.
Explore highlights on program characteristics, enrollment, student and graduate outcomes, faculty, accreditation decisions, and NAAB’s accreditation and International Certification activities.”
2025 NAAB Annual Report on Architecture Education (PDF)
https://www.naab.org/accreditation/publications
Oddly, there appears to be only one report as compared to two in recent years; last year, there was an additional report – NAAB Report on Architecture Education at Minority-Serving Institutions.
For this week’s essay, we will focus on the reports and more specifically, the aggregated statistics of the accredited programs. Below have more details on accredited programs, enrollment, and degrees awarded.
Note: Definitions used in these NAAB reports are based on the glossary of terms used. Integrated Postsecondary Education Data System (IPEDS). IPEDS is the “core postsecondary data collection program” for the National Center for Education Statistics. Data are collected from all primary providers of postsecondary education in the United States in areas including enrollments, program completions, graduation rates, faculty, staff, finances, institutional prices, and student financial aid.
We strongly encourage you to use IPEDS to research institutions you may be considering for your college choice.
Accredited Programs
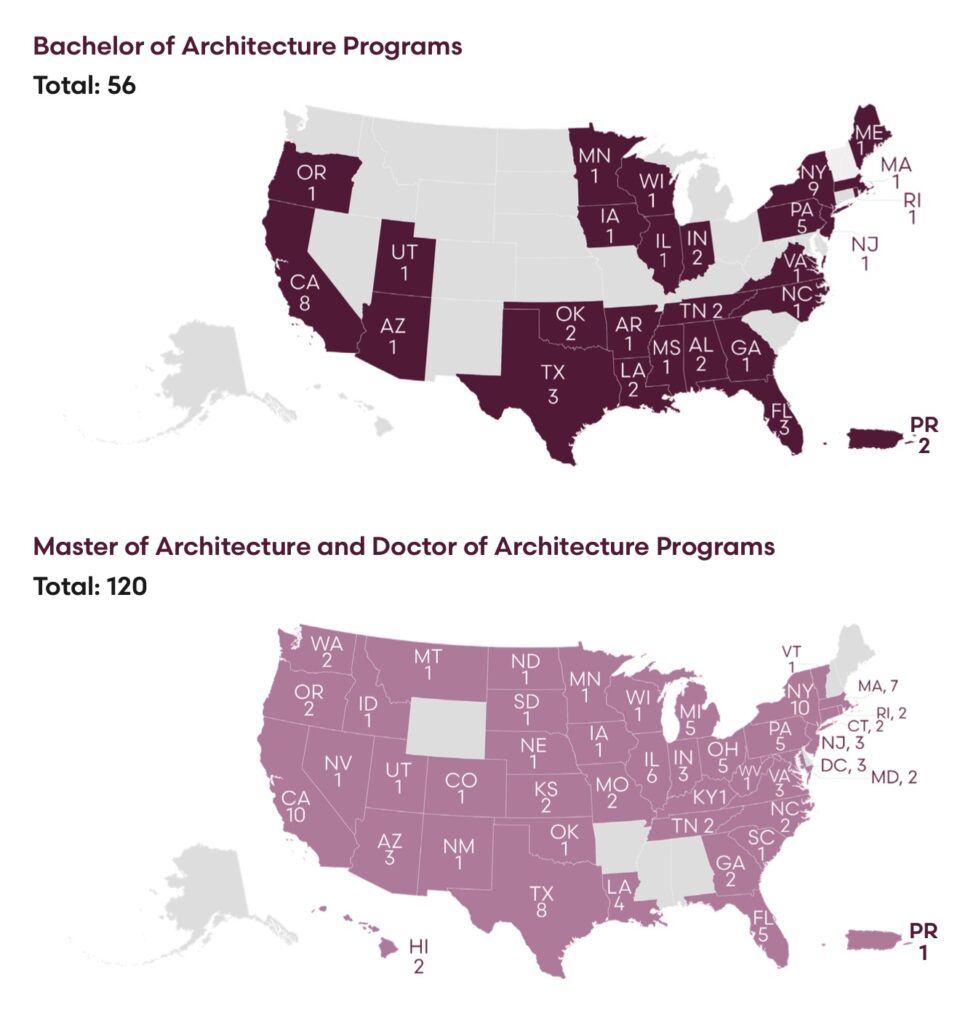
In AY 2024-25, 180 accredited programs were housed in 142 institutions with U.S. regional accreditation. Of the 180 programs, 119 (66%) are Master of Architecture programs, 60 (33%) are Bachelor of Architecture programs, and 1 (1%) is a Doctor of Architecture program. NAAB is managing 14 programs seeking or in candidacy for accreditation
Enrollment
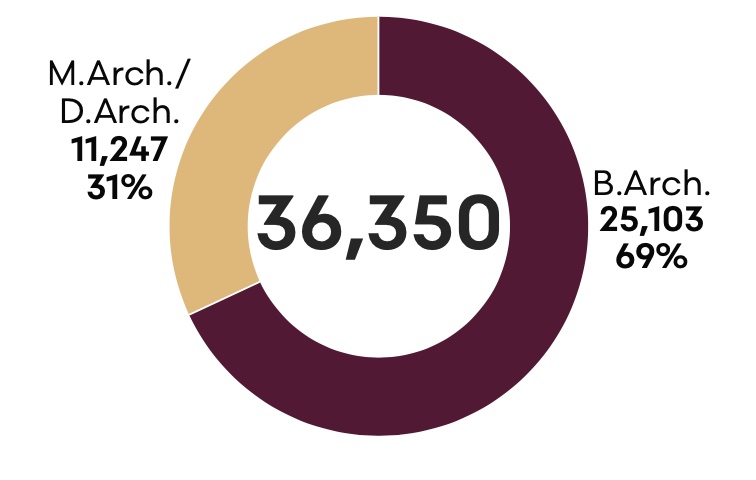
There are 36,350 students enrolled in NAAB-accredited degree programs: of this total, 25,103 (69%) are enrolled in Bachelor of Architecture programs, 11,247 (31%) in Master of Architecture and Doctor of Architecture programs.
Overall Enrollment
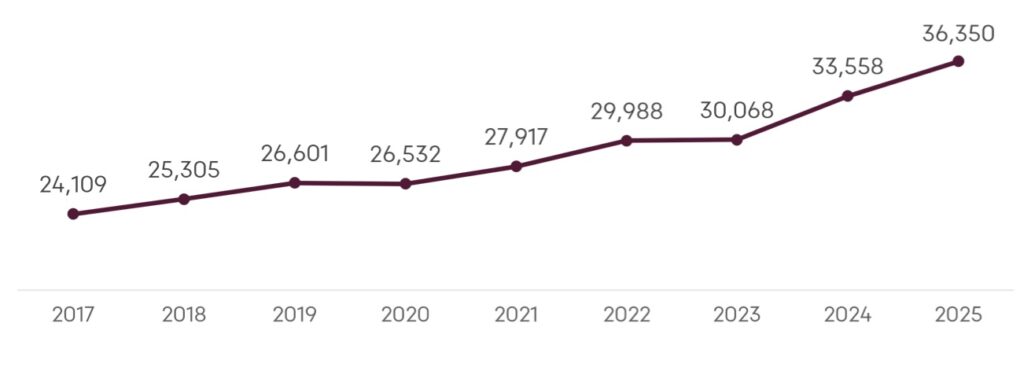
Overall, enrollment in accredited programs increased by a net of 2,792 students, or 8%, from AY 2023–24, when 33,558 students were enrolled in accredited degree programs. Enrollment in B.Arch. programs increased by 5,812 students and enrollment in M.Arch./D.Arch. programs decreased by 3,020 students.
Enrollment by Gender (from 2024 Annual Report)
The gender breakdown of enrolled students is 15,127 (45%) males, 18,297 (55%) females and 134 (0.4%) non-binary. In 2019–20, the percentage breakdown was 50% male students and 50% female students. The percentages are statistically the same for the B. Arch., D.Arch., M. Arch. degrees.
Enrollment by Ethnicity (from 2024 Annual Report)
For B.Arch. programs, the race/ethnicity breakdown was White: 7,337 (38%), Hispanic/Latino: 4,835 (24%), Asian: 2,075 (11%),Nonresident Alien: 1,822 (9%), Black/African American: 1,188 (6%), Race/Ethnicity Unknown: 1,171 (6%), Two or more races: 789 (4%), American Indian/Alaska Native: 50 (0.3%), Native Hawaiian/Pacific Islander: 24 (0.1%).
For M.Arch./D.Arch. programs, the race/ethnicity breakdown was White: 5,433 (38%), Hispanic/Latino: 2,982 (21%), Nonresident Alien: 2,353 (16%), Asian: 1,365 (10%), Black/African American: 1,102 (8%), Race/Ethnicity unknown: 469 (3%), Two or more races: 469 (3%), American Indian/Alaska Native: 83 (0.1%), Native Hawaiian/Pacific Islander: 12 (0.2%).
The 2025 NAAB Annual Report on Architecture Education does NOT include any statistics on Enrollment by Gender or Ethnicity.
As stated last year, the report no longer provides detailed information on Candidate Programs, First Time Enrollment and Preprofessional Programs. As well, the information on Degrees Awarded is not reported.
Now, what does this all mean. First and foremost, it helps you understand the state of architectural education on the macro scale. Perhaps, you know the number of students at your institution, but did you know the total number of architecture students in the country.
Next, the number of architecture students has changed considerable over the past ten years in 2017, overall enrollment was 24,109; the enrollment has increased by just over 50%. While we are not aware of the trend in other academic majors, it begs the question what trends exist with other majors.
Additional statistics are included in the report; download the full report and review.